Just focus on metrics that reveal a tennis player’s edge: serve percentage, break conversion and injury history, plus head-to-head trends and surface performance to spot value. Weigh recent form vs long-term numbers, and flag danger signals such as recurring injuries and positive momentum like sustained win streaks.
Decoding the Numbers: Key Tennis Player Metrics
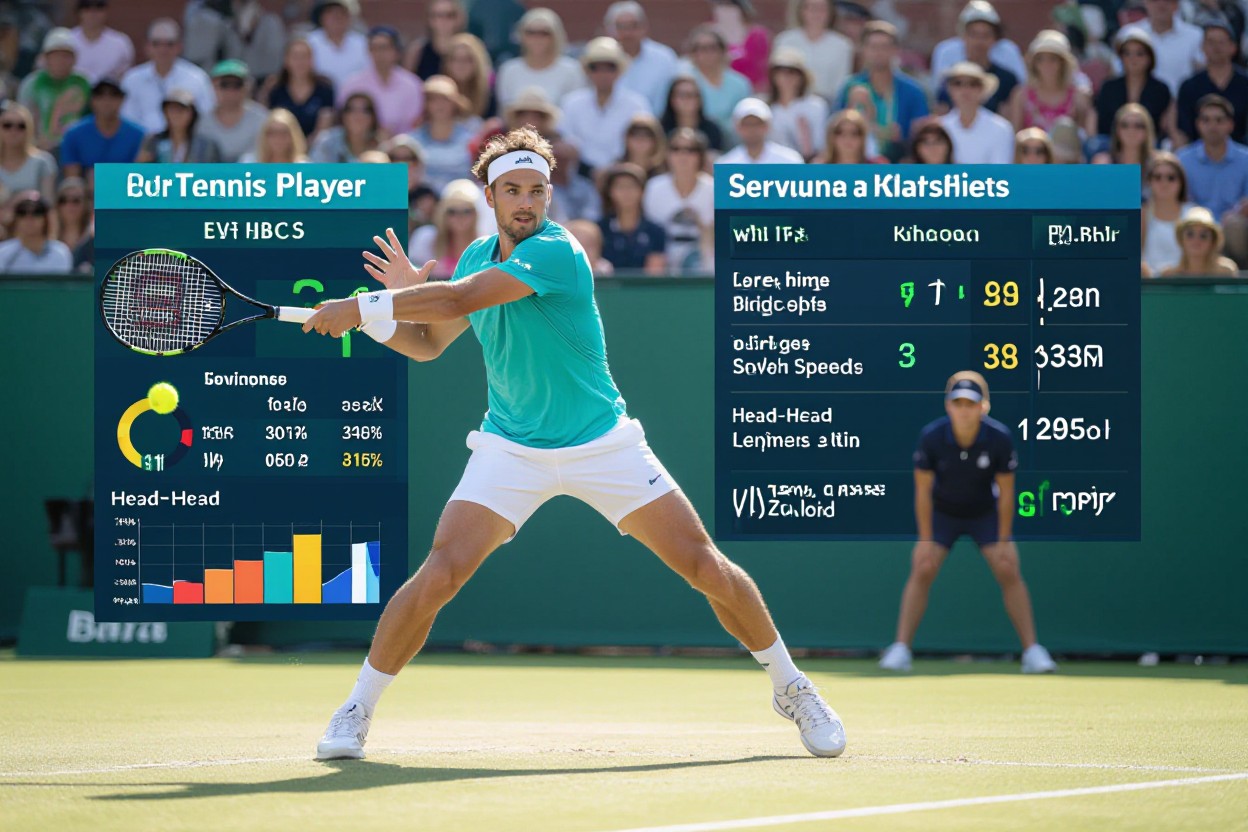
Numbers separate good from great: analyze a tennis player’s first-serve percentage, break-point conversion, return games won and recent form over 20–50 matches to detect trends. Cross-reference match length, fitness and head-to-head styles to spot hidden edges. Combine raw metrics with scouting notes to exploit markets that misprice a player’s surface fit or endurance.
Win-Loss Records and Their Implications
Look beyond overall totals: split a tennis player’s record into last-3, last-6, and last-12-month windows plus last-10 matches and head-to-head vs similar styles. A losing streak of 3+ matches often signals form decline, while an 8–12 match win streak can be regression-prone.
Surface Performance: Hard, Clay, and Grass Analysis
Surface splits reveal where a tennis player’s strengths convert to wins: hard courts reward big servers and aggressive returners, clay favors topspin and stamina, grass amplifies serve-and-volley effectiveness. Look for 10–30 percentage point gaps between surface win rates—e.g., 70% on clay vs 45% on grass—and adjust models for bounce, rally length and altitude.
Drill down into surface-specific metrics: compare a tennis player’s return games won, break-point conversion, and first-serve win rate across surfaces over the last 50 matches. On clay prioritize >55% return games won and heavy topspin depth; on grass prioritize >70% first-serve win and short rally dominance. Monitor transitions—players switching surfaces often show a 10–20% performance dip in the first two tournaments.
The Role of Player Form in Betting Decisions
Evaluating a tennis (wikipedia) player means weighing recent match outcomes, physical condition, and scheduling: a 70% win rate over the last 10 matches signals momentum, while a 10-match losing streak or recurring wrist issues can wipe out value. Correlate form with surface history and match length.
Assessing Recent Performance Trends
Track the last 10–20 matches for patterns: a player averaging 6 aces per match or converting 60% of break points suggests high serving efficiency and return pressure. Note quick turnarounds, travel and bracket difficulty; use external analyses with player form to understand raw stats with contextual factors that move odds for a tennis player.
Long-Term Form vs. Short-Term Fluctuations
Distinguish a tennis player’s durable trends (12-month win %, surface splits, seasonal peaks) from short-term noise like a three-match slump or a lucky upset; surface-specific win rates (e.g., 80% on clay vs 45% on hard) and injury timelines often predict outlook better than a single hot streak.
Use rolling averages (10-match vs 50-match), ELO shifts and head-to-head records to quantify form: a +50 ELO swing across 50 matches shows sustained improvement, while a short-term +30 over 5 matches may regress. Weight sample size—small samples are the most dangerous—and adjust stakes when variance exceeds expected performance for a tennis player.
Injury Reports: A Game-Changer in Betting Outcomes
A fresh injury report can flip lines: Roger Federer underwent knee surgery in 2016 and faced a 6‑month layoff that required rebuilding movement and match timing before winning the 2017 Australian Open, illustrating how layoffs often blunt a tennis player’s sharpness for 3–6 months. Track injury type—soft‑tissue injuries reduce court coverage, structural issues affect serve mechanics—and watch for reduced serve speed or shortened rallies; playing through pain raises the risk of mid‑match retirement.
Analyzing Tournament History Post-Injury
Check a tennis player’s post-return ledger across surfaces and event tiers, prioritizing the first 3 tournaments or initial 6 months and noting service hold %, five‑set endurance and recovery between matches. Filter by Challenger/ATP/WTA level and surface—clay stresses lateral movement while hard courts expose knees.
Quantify recovery by comparing the tennis player’s pre-injury 12‑month metrics to the first 6 months post-return: track win percentage, average sets per match, service games saved and break points faced. Look for an improving trend across three successive events as evidence of regained form; a sustained 10–15% drop in serve effectiveness or repeated medical timeouts signals elevated betting risk.
Head-to-Head Matchups: The Statistical Confrontation
Head-to-head records expose surface-based divides, streaks and matchup quirks that matter for any tennis player bet; Nadal leads Federer 24–16 overall with an overwhelming clay advantage while Federer dominated many grass meetings, showing how surface splits flip probabilities.
Historical Context and Its Relevance
Recent meetings within 24 months weigh far more than decade-old results: small-sample head-to-heads under five matches per surface are noisy. Factor in age, knee or shoulder injuries, and changes in coaching or equipment; a tennis player returning from a 6-month layoff often posts measurable declines in serve speed and return depth.
Psychological Aspects Behind Player Rivalries
Rivalries create a mental edge that shows up in tiebreaks, break-point conversion and comeback frequency: a tennis player who repeatedly loses deciding sets to the same opponent often exhibits tighter serving under pressure and poorer second-serve stats in rematches. Crowd dynamics and historical slams amplify pressure, turning statistical parity into a practical disadvantage.
Deeper analysis looks at body language, time between points and timeout usage as proxies for confidence; winning the first set still gives a tennis player roughly a 70%+ chance to win a best-of-three match, so psychological resilience after dropping set one is measurable and predictive when combined with head-to-head trends and recent form.
External Factors Influencing Match Outcomes
Surface choice, scheduling, crowd support and climate all shift odds for a tennis player; indoor hard courts speed up rallies while high-altitude venues boost serve velocity by noticeable margins. Study match logs and the sport overview on wikipedia to see patterns: late-night matches after long travel often show drop-offs in returns and unforced errors. Player form and recovery windows matter most for value bets.
- Surface (clay/grass/hard)
- Crowd & home support
- Travel & scheduling
- Weather & altitude
Home Advantage and Travel Fatigue
Home crowds and surface selection can swing outcomes; outdoor Davis Cup ties often favor the host who picks a surface that amplifies their strengths, and a tennis player flying across 3+ time zones typically needs 48–72 hours to re-sync circadian rhythms, reducing serve accuracy and movement crispness.
Weather Conditions: The Unforeseen Factor
Wind alters ball drift and net clearance, humidity slows ball bounce, and temperatures above 30°C increase endurance strain; serve speeds can rise in hot, dry air while heavy humidity favors baseline grinders, so a tennis player known for long rallies suffers more in extreme heat. Tournament heat policies (e.g., AO, US events) can change match length and recovery between rounds.
Wind gusts over 20 km/h can force tactical shifts—players reduce serve-and-volley attempts and accept more second-serve points, while heavy dew at night neutralizes slice and low-bouncing shots; match stats often show first-serve percentages drop 3–6% in gusty conditions, and return winners decline when crosswinds predominate. Recognizing how these variables affect a specific tennis player sharpens bet selection.
To wrap up
The best way to analyze a tennis player before betting is to study recent results, surface history, matchup styles and physical condition; evaluate the tennis player’s serve, return and stamina, then combine stats with bankroll discipline to place data-driven wagers.